Past results for Special Olympics North Carolina swim meets have been entered into a database for easy access by coaches. This database is not managed by SONC so any questions or comments should be directed to Chris Underwood at chris@raleighracers.org. Information on how to navigate the results can be found at the bottom of this page.
The database contains data as far back as 2012 for those events which have been entered in SONC’s GMS system.
Last Updates: Results from 2025 Southeast Swim Meet 2025-05-01, 2025 Craven County Meet 2025-05-22, Durham Invitational 2025-05-18.
Click on your County below to view the results.
Alamance
Avery
Beaufort/Hyde
Brunswick
Buncombe
Burke
Cabarrus
Caldwell
Carteret
Caswell Center
Catawba
Cherokee
Cleveland
Craven
Cumberland
Dare
Davie
Durham
Forsyth
Gaston
Guilford/Greensboro
Guilford/High Point
Harnett
Haywood
Iredell
J Iverson Riddle Develop Center
Johnston
Jones
Lake Norman
Lincoln
Mecklenburg
McDowell
Navigating the Results
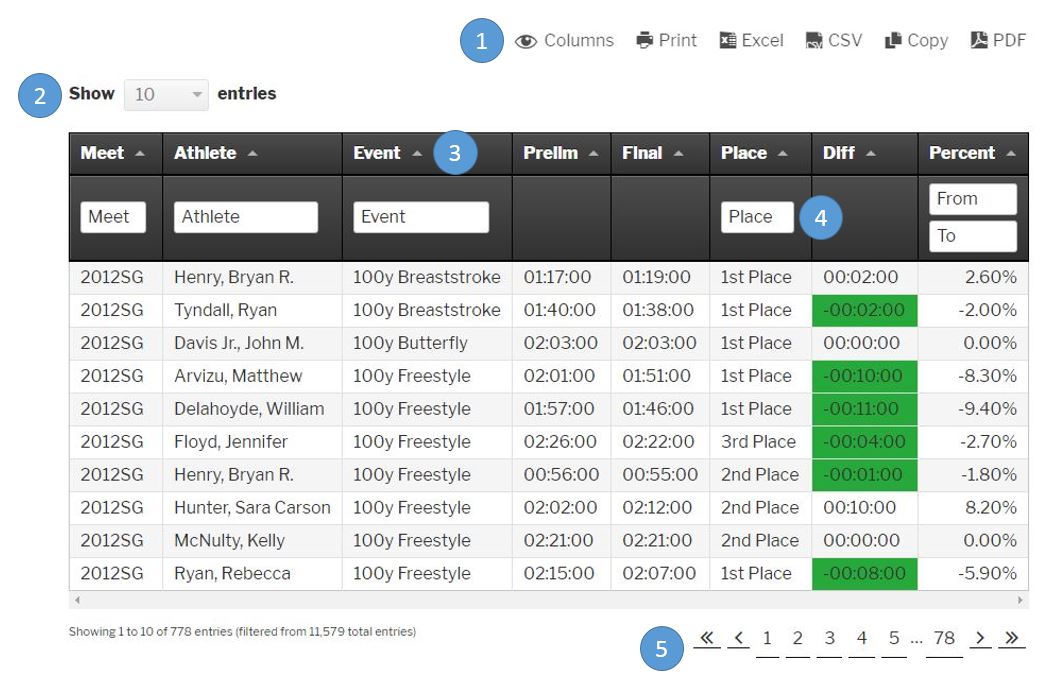
Each number below refers to the number in the picture above.
- Table tools that allow you to do different things with the table data. For example, the Columns icon will allow you to modify the columns that are displayed in the table. The other icons will allow you to print the results, export to Excel, CSV, PDF or copy them to the clipboard. For examples see Hide or Display Columns or Exporting the Selected Data below.
- Change the number of entries to show on the page
- Click the triangle beside the column header to sort that column in ascending or descending order. See Filtering and Sorting Data below for an example.
- Enter text in any of the fields to filter the data based on the information entered. For example, If you start typing “2016” in the “Meet” filter any record that contains “2016” in the meet field will be displayed. For the Percent field you can also filter based on a range. For examples on filtering data see Filtering and Sorting Data below.
- Move from page to page or from beginning to end of results.
Diff and Percent Columns
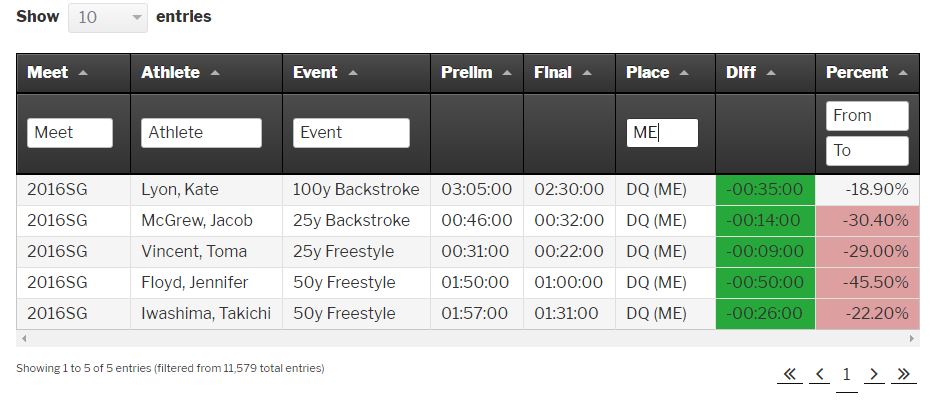
If the cell in the Diff column shows the difference between the preliminary and final time for the event. A negative number indicates that the athlete had a final time faster than their preliminary time. The cell will be shaded green if the final time is faster. This field with be blank if the received a “DNF” (Did not finish), “DNS” (Did not swim) or “DQ”. If the athlete happened to exceed the Maximum Effort Threshold for their event they will have received a “DQ (ME)”.
If the cell in the Percent column is shaded red this indicates that the athlete beat their preliminary time more than 20%. A negative percentage means they beat their preliminary time and a positive percentage indicates they were slower.
Display or Hide Columns
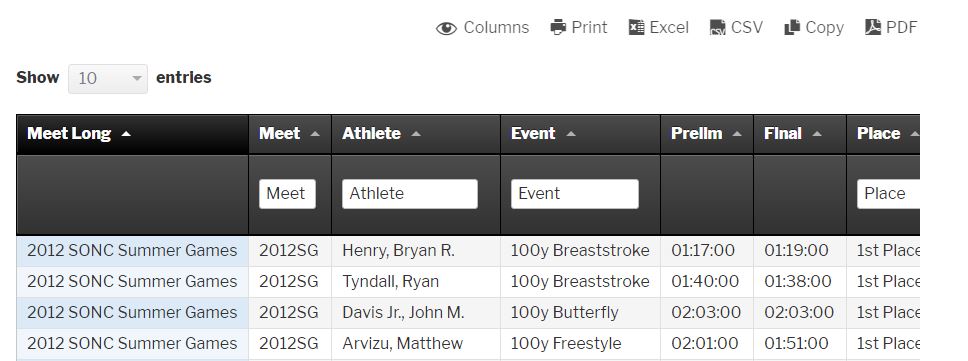
To display or hide columns in the table click on Columns icon (looks like an eye) from the list of tools at the top of the table. When clicked a list of column names will be displayed. Select the column(s) that you would like to show or hide and when finished click anywhere outside the list to make the list disappear. For example, by default the bale only displays the short meet name field. If you wanted to display the full meet name click on the Columns icon and choose “Meet Long”. The screenshots below show this example.

Filtering and Sorting the Data
In most cases you want to filter the data to display only what you are interested in seeing. The data can be filtered by using any of the filter text boxes above each of the columns.
Example 1 below is filtering the data on the place column and searching for all the athletes who were DQ’d because of the Maximum Effort rule. This is done by placing “ME” in the place filter.
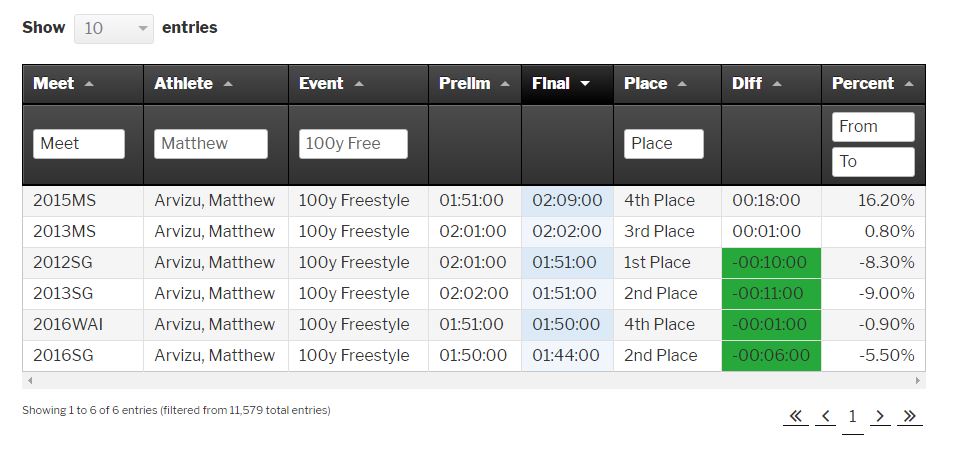
Data can also be filtered by more than one column by simply filling in the filter box above each column you would like to filter on. In addition that data can be sorted by clicking on the arrow in any column. In Example 2 below the data is filtered on athlete and event then sorted descending by Final time (notice the arrow is pointing down).
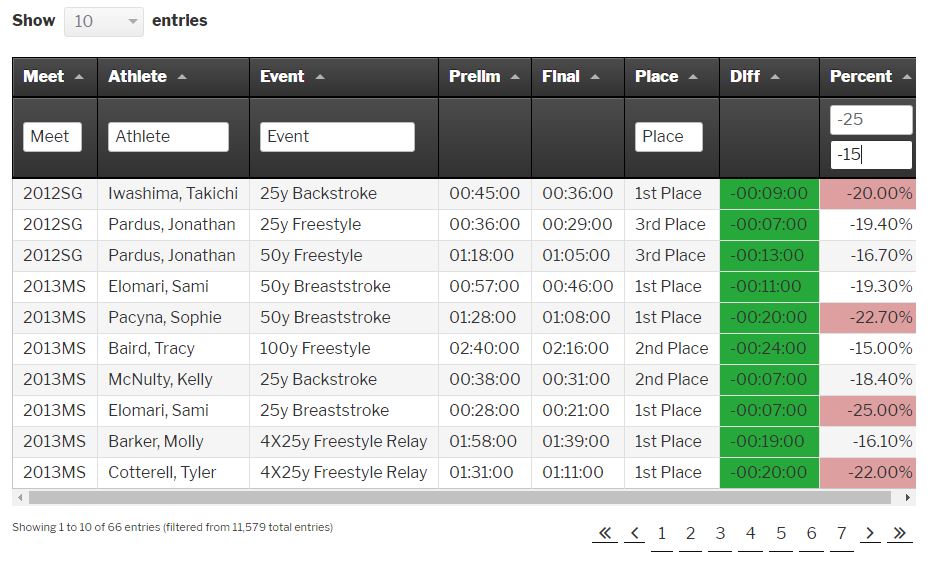
For the Percent column the values can be filtered based on a range. Keep in mind that if you are searching for a percentage for an athlete who had a final swim time faster than their preliminary use a negative number. For example, using -25 in the From and -15 in the To field will give you any athlete who beat their preliminary time by 15-20%. Example 3 below shows an example of filtering the data based on all athletes who’s final time was faster then the preliminary by 15-25%.
Exporting the Selected Data
The tools above the table allow you to select the data that you currently have loaded to you PC in a number of formats. When exporting a large number of entries be patient and only click the icon once. Example 4 shows the downloaded meet results after the “Excel” tool was clicked.

